Amazon TACoS vs ACoS: Calculate Advertising Spend Against Sales and Profit
Amazon TACoS vs ACoS explained with formulas, a worked sales example, contribution margin and the traps that make low TACoS misleading.
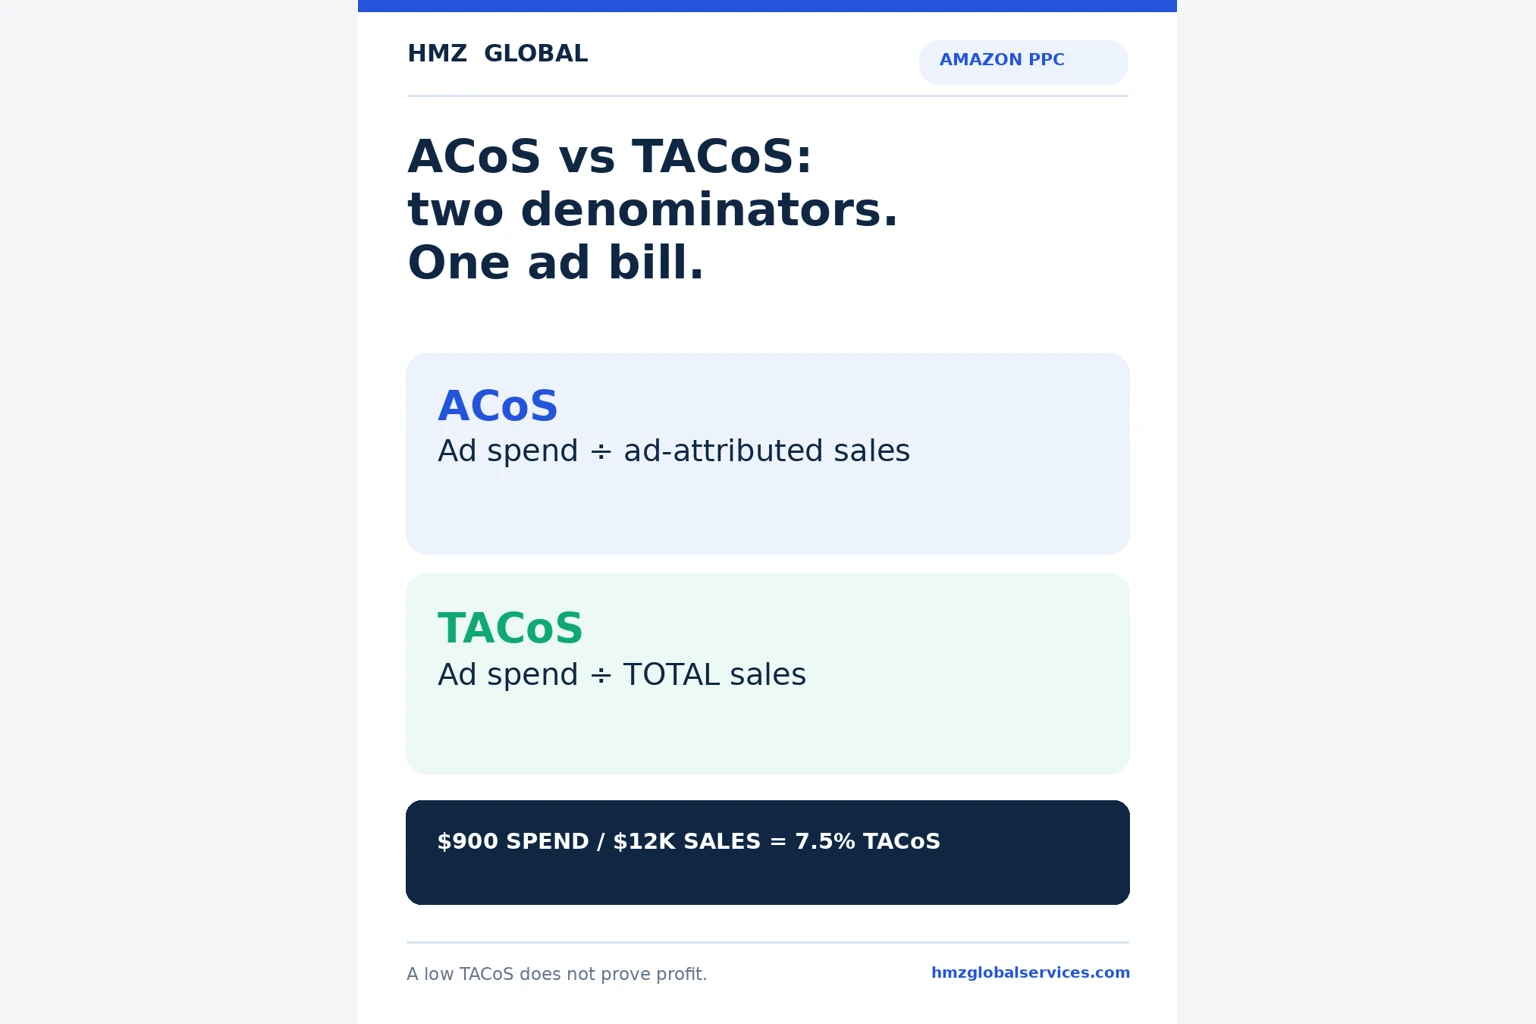
ACoS measures ad spend relative to sales credited to ads. TACoS measures the same spend relative to total sales—paid and organic combined. Neither figure, by itself, proves a product is profitable.
The reason is straightforward: a seller can have a low TACoS because of strong organic sales while the advertising portion of the business loses money. Or TACoS can rise temporarily while ads introduce a new product, without proving that the strategy is wasteful. You need both metrics plus unit economics.
Amazon Ads formally defines ACoS as advertising spend divided by ad-attributed revenue. TACoS is a widely used seller-side convention based on total product sales rather than a universal official Amazon Ads metric. Amazon Ads: What Is ACoS?.
1. Formulas (same currency and reporting period)
ACoS = Advertising spend / Ad-attributed sales × 100
TACoS = Advertising spend / Total sales × 100
ROAS = Ad-attributed sales / Advertising spend
Example: $900 of spend, $3,000 in ad-attributed sales and $12,000 in total product sales:
- ACoS = 900 / 3,000 = 30%
- TACoS = 900 / 12,000 = 7.5%
- ROAS = 3,000 / 900 = 3.33×
TACoS looks very low compared with ACoS because the denominator includes $9,000 of sales not credited to these ads. The difference says something about the mix of sales, not necessarily campaign profitability.
2. Worked profit example: lower TACoS, losing ad orders
Suppose a seller sells the same $30 item through both paid and non-ad sales. Illustrative costs per item: product $11, Amazon/fulfillment fees $9 and other variable costs $3, leaving $7 contribution per order before ads.
| Monthly measure | Value |
|---|---|
| Units sold | 400 |
| Total revenue | $12,000 |
| Ad-attributed revenue | $3,000 |
| Ad spend | $900 |
| ACoS | 30.0% |
| TACoS | 7.5% |
| Contribution before ads (400 × $7) | $2,800 |
| Contribution after ads, before overhead and returns | $1,900 |
At $30 per sale, $7 pre-ad contribution means break-even ACoS is 7/30 = 23.3% for attributed ad orders, under this simplified per-order model. At 30% ACoS, ad cost per attributed $30 order is $9, or $2 above pre-ad contribution. The overall product line still shows $1,900 contribution because non-ad orders support the total; that does not make the attributed ad orders profitable.
Do not treat TACoS as a proxy for net profit. It leaves out product cost, Amazon fees, returns, storage, fixed overhead and the distinction between incremental and merely attributed sales.
For a focused guide to breakeven ACOS, see our ACoS and ROAS calculation article.
3. When ACoS and TACoS move in opposite directions
| Pattern | Potential explanation | What to check next |
|---|---|---|
| ACoS rising, TACoS flat | Advertising is less efficient but organic revenue remains strong | Query targeting, CPC, conversion rate, contribution |
| ACoS falling, TACoS rising | More overall revenue is now ad-driven | Organic ranking and contribution per order |
| Both declining | Paid spend becomes lighter relative to both sales pools | Did inventory, prices or seasonality change? |
| Both increasing | More ad cost relative to paid and total revenue | Stock, pricing, traffic quality, listing conversion |
Those are diagnostic hypotheses, not laws. Attribution delays, sales mix, competitor activity and Amazon reporting windows can alter the picture.
4. Your true break-even guardrails
For a simple single-item ad order:
Pre-ad contribution per unit = selling price − landed cost − fulfillment/referral fees − payment or other variable costs − expected variable return/discount allowances.
Break-even ACoS = pre-ad contribution / selling price × 100.
With a $30 selling price and $7 contribution, the ceiling is 23.3% before overhead. The target must be below that level if you also require profit on ad-driven orders. Different SKUs have different margins; blending them into one account average conceals weak items.
At the business level:
Estimated contribution after ads = sum of pre-ad contribution across all fulfilled orders − advertising spend.
Do not use “revenue minus advertising” as profit. Also, revenue attributed to ads is not necessarily incremental revenue; some shoppers would have purchased organically.
5. How to build a reliable weekly dashboard
Track for each SKU or product group: ad spend, attributed sales, total sales, ACoS, TACoS, total units, gross/variable contribution before ads, contribution after ads, returns/refunds and stock availability. Keep the time period, currency and SKU grouping consistent. Note that attribution windows may delay revenue reporting relative to spend.
Minimal dashboard example:
| KPI | Formula | Why it matters |
|---|---|---|
| ACoS | Spend / attributed sales | Ad-reported efficiency |
| TACoS | Spend / total sales | Spend burden across all sales |
| Pre-ad margin % | Pre-ad contribution / total revenue | Breakeven economics |
| Contribution after ads | Pre-ad contribution − spend | Actual variable contribution |
| Organic/non-ad revenue estimate | Total sales − attributed revenue | Directional view only; beware attribution definitions |
Using TACoS with mismatched reporting periods or platforms can make healthy campaigns appear worse or unhealthy ones appear better. Do not compare reported ACoS from one attribution window with total revenue from another without documenting the difference.
6. Actions to take when metrics are poor
- High ACoS with weak listing conversion: investigate relevance, price, reviews, photos, delivery promise and product detail page before aggressively increasing bids.
- Low TACoS but ad orders below break-even: consider reducing wasteful spend or re-evaluating incremental sales; do not declare victory.
- Rising TACoS during a launch: check contribution runway, customer acquisition strategy and whether organic position improves rather than blindly targeting a generic benchmark.
- Stable ACoS but falling total contribution: revisit product cost, returns, storage, discounting and price changes.
Our Amazon PPC clicks but no sales diagnosis and placement bid adjustment guide cover two common causes of inefficient spend.
Bottom line
ACoS helps answer “How costly are the sales attributed to my ads?” TACoS helps answer “How much of total revenue am I spending on ads?” Profitability still requires real product and fulfillment costs. Use the numbers together and make decisions by SKU and contribution rather than by a generic “good ACoS” benchmark.
For practical PPC optimization and store operations, see HMZ Global's PPC & Store Management services or request a discussion.